3.5.5. Sentinel-2 Level-2 products
Index
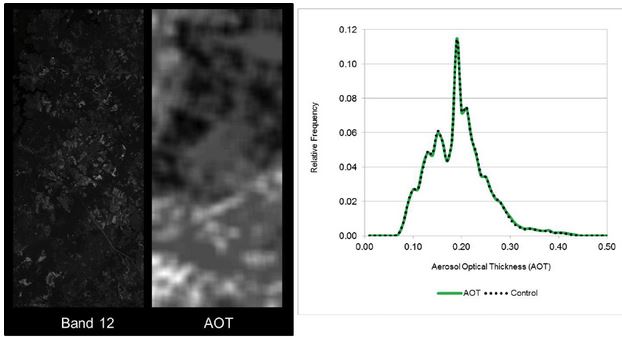
- Aerosol Optical Thickness
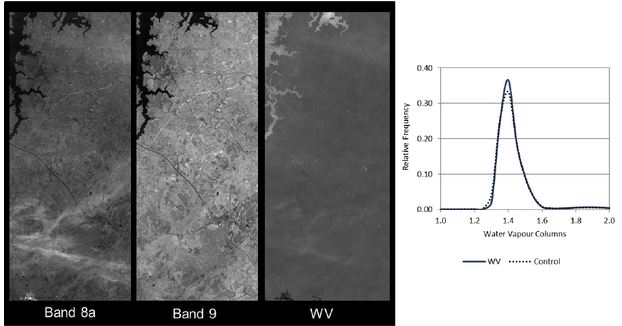
- Water Vapour
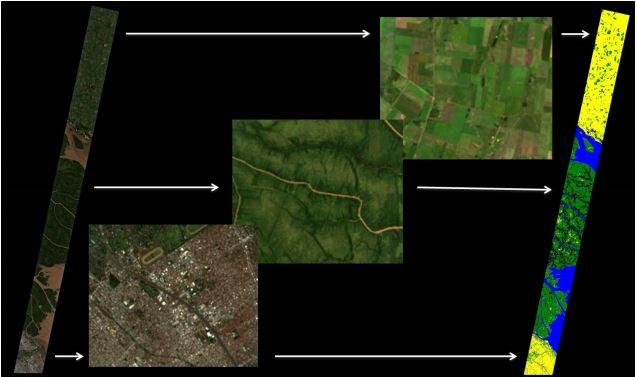
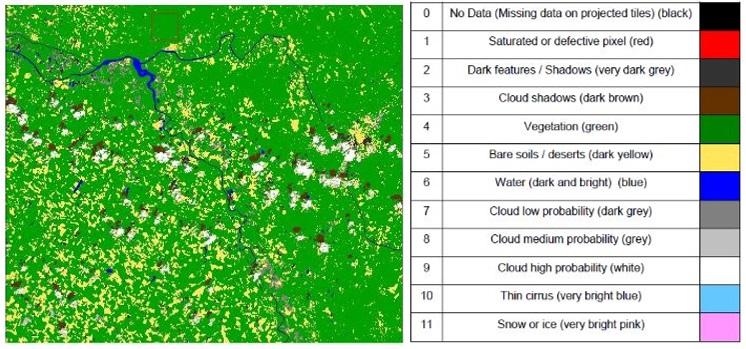
- Scene classification
- Leaf Area Index
- Fraction of Vegetation Cover
- Graction of Absorbed Photosynthetically Active Radiation
- Normalized Difference Vegetation Index
- Cloud mask
- Signal to noise ratio bands
- Broadband hemispherical-directional reflectance factors
the Aerosol Optical Thickness (AOT) retrieval provides a measure for the visual transparency of the atmosphere. It is derived using the DDV (Dense Dark Vegetation) algorithm, using the (SWIR) band 12 and correlates its reflectance with bands 4 (red) and 2 (blue). The algorithm requires that the scene contains reference areas of known reflectance behaviour, preferably Dark Dense Vegetation (DDV) and/or dark soil and water bodies.
|
Water Vapour (WV) retrieval over land is performed with the Atmospheric Pre-corrected Differential Absorption algorithm (APDA, [6]) which is applied to the two Sentinel-2 bands B8a, and B9. Band 8a is the reference channel in an atmospheric window region. Band B9 is the measurement channel in the absorption region. The absorption depth is evaluated by calculating the radiance for an atmosphere with no water vapour, assuming that the surface reflectance for the measurement channel is the same as for the reference channel. The absorption depth is then a measure of the water vapour column content.
|
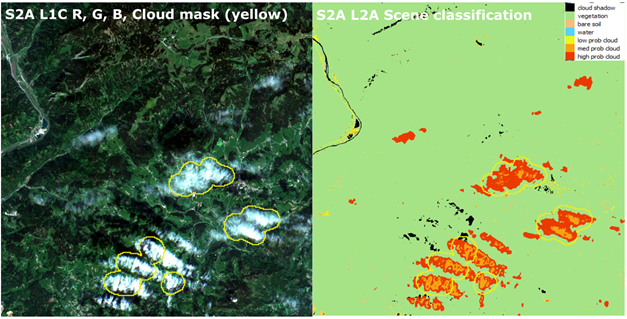
The main output of the Cloud Screening and Scene Classification (SCL) module consists in a Scene Classification map. Together with the Scene Classification map, two quality indicators are provided: a Cloud confidence map and a Snow confidence map with values ranging from 0 to 100 (%).
source: Müller-Wilm, U., Louis, J., Richter, R., Gascon, F., Niezette, M., 2013. Sentinel-2 Level 2a Prototype Processor : Architecture , Algorithms and First Results. ESA Living Planet Symp. 2013, Edinburgh, UK 2013, 3–10. The Figure below compares the Level 1C cloud mask and scene classification.
|
Leaf area index (LAI) is a dimensionless quantity that characterizes plant canopies. It is defined as the one-sided green leaf area per unit ground surface area (LAI = leaf area / ground area, m2 / m2) in broadleaf canopies. In conifers, three definitions for LAI have been used:
LAI ranges from 0 (bare ground) to over 10 (dense conifer forests) Sources: Atzberger, C., Richter, K., 2012. Spatially constrained inversion of radiative transfer models for improved LAI mapping from future Sentinel-2 imagery. Remote Sens. Environ. https://doi.org/10.1016/j.rse.2011.10.035 Zheng, G., Moskal, L.M., 2009. Retrieving Leaf Area Index (LAI) Using Remote Sensing: Theories, Methods and Sensors. Sensors 9, 2719–2745. https://doi.org/10.3390/s90402719 |
The Fraction of Vegetation Cover (FCover) corresponds to the fraction of ground covered by green vegetation. Practically, it quantifies the spatial extent of the vegetation. Because it is independent from the illumination direction and it is sensitive to the vegetation amount, FCover is a very good candidate for the replacement of classical vegetation indices for the monitoring of ecosystems. Source: Verrelst, J., Muñoz, J., Alonso, L., Delegido, J., Rivera, J.P., Camps-Valls, G., Moreno, J., 2012. Machine learning regression algorithms for biophysical parameter retrieval: Opportunities for Sentinel-2 and -3. Remote Sens. Environ. https://doi.org/10.1016/j.rse.2011.11.002 |
The Fraction of Absorbed Photosynthetically Active Radiation (FAPAR) is the fraction of the incoming solar radiation in the Photosynthetically Active Radiation spectral region that is absorbed by a photosynthetic organism, typically describing the light absorption across an integrated plant canopy. This biophysical variable is directly related to the primary productivity of photosynthesis and some models use it to estimate the assimilation of carbon dioxide in vegetation. F. Baret, M. Weiss, R. Lacaze, F. Camacho, H. Makhmara, P. Pacholcyzk, B. Smets, 2013 GEOV1: LAI and FAPAR essential climate variables and FCOVER global time series capitalizing over existing products. Part1: Principles of development and production, Remote Sens. Environ 2013, Vol 137, 299-309, |
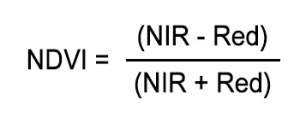
The Normalized Difference Vegetation Index (NDVI) is a simple graphical indicator that can be used to analyze remote sensing measurements, typically, but not necessarily, from a space platform, and assess whether the target being observed contains live green vegetation or not. The index can be computer with the atmosphericaly corrected near infra-red (NIR) and red bands see the formula bellow.
|
The cloud mask is generated at Level-1C and is based on the 60 m resolution constituent spectral bands (Band 1 at 443 nm or Band 2 at 490 nm, Band 10 at 1 375 nm and a SWIR of either Band 11 at 1 610 nm or Band 12 at 2 190 nm). To minimise the potential errors arising as a result of an outlying value (such as a geometric error, or the presence of a highly reflective object in the VIR) and to ensure that any pixel flagged as cloud-free is truly cloud-free, an additional morphology-based filtering step is undertaken. Under this filtering, the presence of spatially isolated pixel values is mitigated (erosion), followed by a dilation of local values into the gap. |
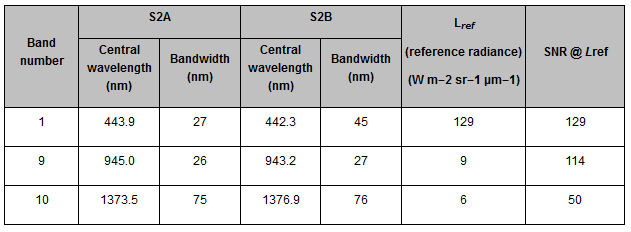
The signal to noise ratio (SNR) bands are calculated from images ofthe MSI sun diffuser are provided at level-1C and consists of three 60 meter spatial resolution bands which are mainly for cloud screening and atmospheric corrections.
|