3.4.1.3.4. Seasonal RGB Composite
Building upon monthly or seasonal means, the TU Wien seasonal RGB composites convey changes in land cover by setting each band of an RGB image to a mean covering different timespans of a year.
Product overview
The TU Wien seasonal RGB composites were built upon the monthly mean backscatter data, which was delivered after a series of pre-processing steps using the SAR Geophysical Retrieval Toolbox(SGRT). The composites products can vary between different combinations of Sentinel-1 polarisations (VV, VH or the cross-ration VH/VV) and timely averages (e.g., using the monthly mean or seasonal mean of backscatter images). The processing results in the false color composites, which represents the characteristics of different data band inside one composite as the intensity of its color. The product is considered useful for the tasks that involved land cover characterisation or/and crop classification and mapping because of its clear visual impression and the high-resolution of the datasets.
Within the scope of this project, different composites will be delivered and ingested into the Data Cube, which are the false color RGB composite for each season (spring, summer, autumn and winter) and additionally, one VH composite of the growing season. The overview of RGB composite products can be found in the table below.
| Composite name | Code name | Red band | Greenband | Blue band |
|---|---|---|---|---|
| Seasonal RGB Composite - Spring | S-COMP003 | March - VV | April - VH | May - VH/VV |
| Seasonal RGB Composite - Summer | S-COMP004 | June - VV | July - VH | August - VH/VV |
| Seasonal RGB Composite - Autumn | S-COMP005 | September - VV | October - VH | November - VH/VV |
| Seasonal RGB Composite - Winter | S-COMP006 | December - VV | January - VH | February - VH/VV |
| Seasonal RGB Composite - Growing Season | S-COMP007 | June - VH | July - VH | August - VH |
The overview of RGB composite products that are currently available in the Data Cube.
Product description
Generally, the RGB composite products will be thresholded using the lower and upper thresholds which were derived by empirical experiments on the histogram of the input bands. Thresholding in here means all the values which go beyond the pre-defined thresholds will be set to the value of the thresholds. Other values will be linearly scaled from lower to upper thresholds.
This step is used to make sure that most of the output composites will not have any extreme value on one or more bands. The detail information on which threshold values were applied on each polarisation/polarisation combination is represented in the table below.
| Polarisation/Polarisation Ratio | Unit | Lower threshold | Upper threshold |
|---|---|---|---|
| Vertical-Vertical (VV) | dB | -14 | -4 |
| Vertical-Horizontal (VH) | dB | -21 | -12 |
| Cross-ratio (VH/VV) | dB | -7 | -1 |
The unit and thresholds for every polarisation/polarisation ratio.
After thresholding the input images, the value of the three input bands will be linearly scaled to the range 0-254. The value itself will be stored as an integer for the sake of space saving. Readers are referred to the subsection "Product variables" for detail information on output data encoding. The value 255 of that output 8-bit integer will be reserved to store no-data value or the data which have been previously masked before.
Product variables
The product variables are defined for each band and each sub-products. Below is an example of the product variables for the Seasonal RGB Composite product for the growing season.
| Composite name | Code name | Band | Polarisation | Month | Threshold min | Threshold max | Type | Byte size | No -data |
|---|---|---|---|---|---|---|---|---|---|
| Seasonal Growing Season | S-COMP007 | Red | VH | June | -21 dB | -12 dB | uint8 | 1 | 255 |
| Seasonal Growing Season | S-COMP007 | Green | VH | July | -21 dB | -12 dB | uint8 | 1 | 255 |
| Seasonal Growing Season | S-COMP007 | Blue | VH | August | -21 dB | -12 dB | uint8 | 1 | 255 |
An example of product variables of the Seasonal RGB Composite product for the growing season
Area and time period
RGB composite product has been computing over the area of Austria from 01st January 2016 to the present.
Temporal resolution
RGB composite images are computed based on the monthly mean backscatter images. This means that there will be a new RGB composite image (for a specific composite) after a month since there are new monthly mean backscatter images every month.
Image timestamps
Different to the soil moisture product, there are the start date and end date of the first and the last acquisition that was used to calculate the monthly mean products, res instead of the date and the time of the acquisition. They can also be found in the metadata header of the original GeoTiff file.
Spatial resolution and sampling
Originally, the S-COMP images are tiled and georeferenced using the TU Wien Equi7(see Data specifications and formats) and have easting and northing coordinates with the pixel spacing of 10m.
Data format
The S-COMP data is originally stored and delivered in GeoTIFF format. GeoTIFF is a standard which allows storing georeferencing information within a TIFF raster image.
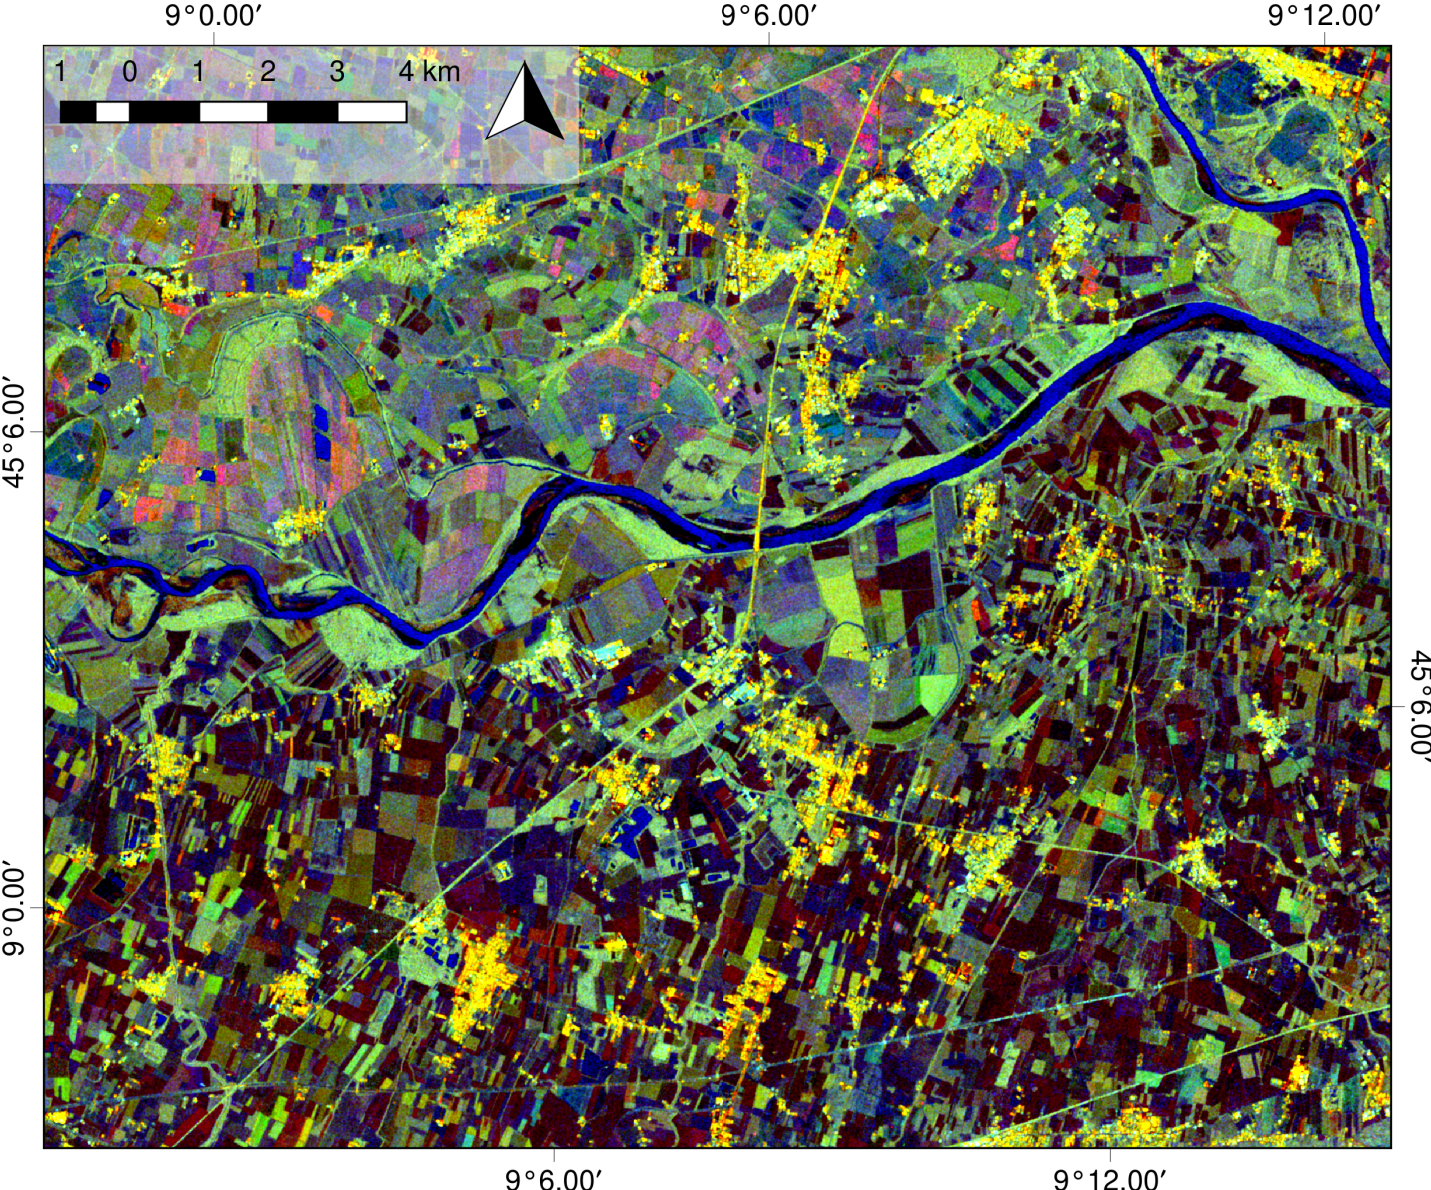
Sentinel-1 Seasonal RGB Composite product at 10m spatial sampling over South West Pavia, Italy. Red band, green band and blue band are represented by Sentinel-1 VV polarisation image of June 2017, Sentinel-1 VH polarisation of July 2017 and the cross-ratio (VH/VV) of August 2017, respectively.
| Product Name | Seasonal RGB composite |
|---|---|
| Code Name | S-COMP |
| Category | Sentinel-1 products |
| Spatial Sampling | 10m |
| Temporal Resolution | 1 month |
| Unit | dB (scaled) |